

Comparing the Top 10 Ag States: 2024 Versus 2022
We review how livestock states have gained on crop states


I wanted to see how much the ag map has changed since the 2022 peak, so I pulled USDA’s top ten states for both years and put them side by side.
The same ten states are still on the list. Nobody dropped off and nobody new showed up. But five of them changed rank, and one state moved two spots in each direction.
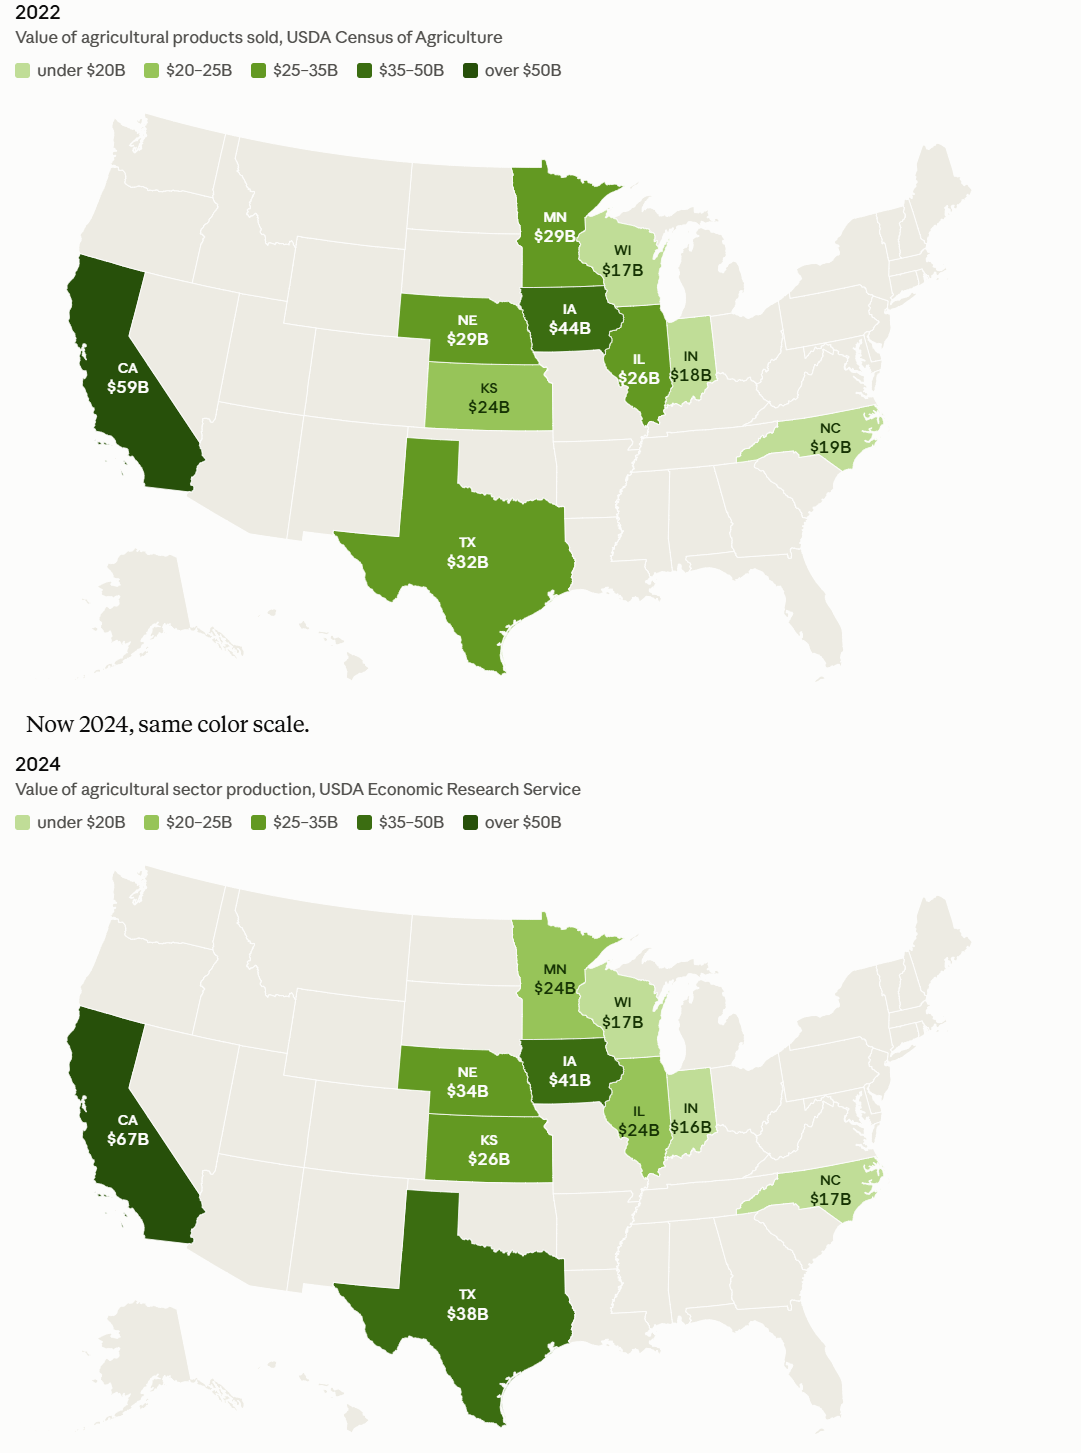
Here is the comparison:
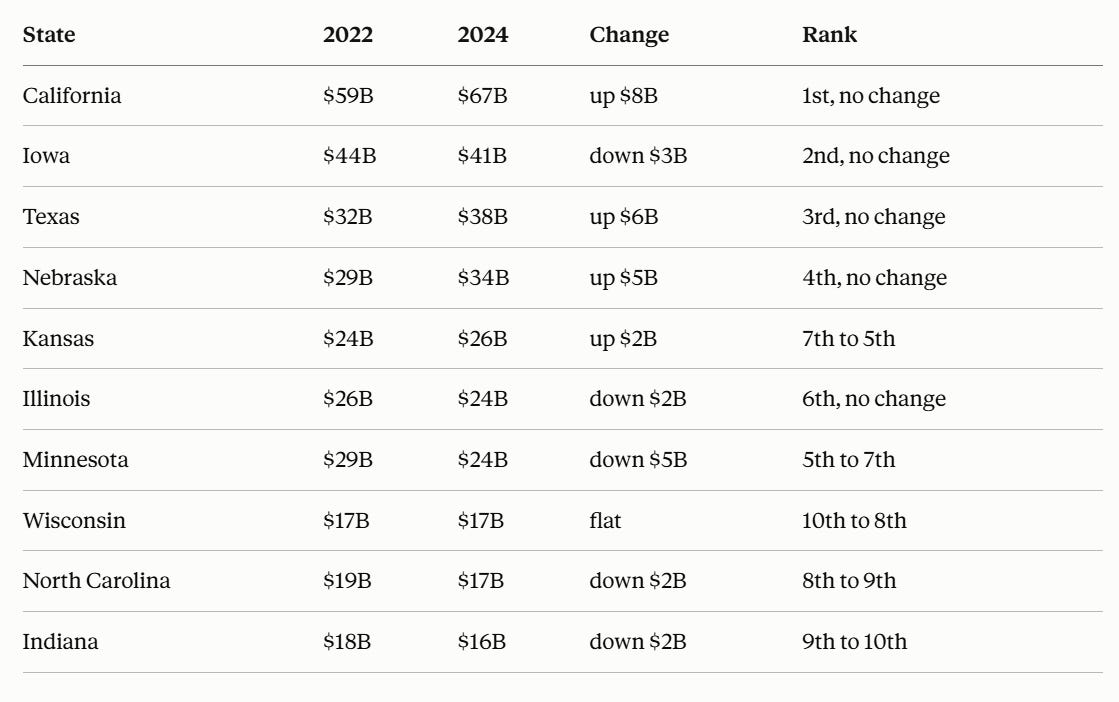
Every state that gained is a cattle or dairy state
Texas added $6 billion. Nebraska added $5 billion. Kansas added $2 billion and jumped from seventh to fifth.
Cattle is now the top commodity in eighteen states, more than any other product. It is the largest single line in Nebraska at $17.8 billion, Kansas at $14.8 billion, and Texas at $13.6 billion.
Every state that lost is a corn and soybean state
Minnesota dropped $5 billion and fell from fifth to seventh. Iowa dropped $3 billion. Illinois, Indiana, and North Carolina each dropped about $2 billion.
Corn in Iowa came in at $11.7 billion for 2024. In Illinois it was $10.2 billion. Both are well off where they were when prices peaked.
Wisconsin moved up without earning a dollar
Wisconsin went from tenth to eighth and its number did not move. Dairy held at $7.0 billion while the grain states around it slid backward. Standing still was enough to pass two states.
California is still in its own category
California added $8 billion and now sits at $67 billion, roughly $26 billion ahead of Iowa. And its biggest commodity is not almonds or grapes. It is dairy, at $8.6 billion.