

How SDRP Stage 2 Works
We are providing guidance for everyone on Stage 2 plus a calculator.


We have posted several times on SDRP Stage 2 in our blog over the last couple of weeks and based on feedback from our readers plus being on RFD TV and other media, we thought it would be a good idea to provide our calculator for everyone and go over how SDRP Stage 2 works.
The SDRP Final Rule had an example of how they would calculate the SDRP Stage 2 payment. In the example, they used a price of $10.03 for 2024 soybeans which was the harvest price. However, the final calculations are using the projected price, therefore payments under SDRP Stage 2 will be yield only for those producers who had a shallow loss (they did not get an original crop insurance indemnity). This is different from Stage 1.
The bottom line is if your final harvest yield was not less than 95% of your APH, you will not collect anything under SDRP Stage 2. Also, the payment limit is $125,000 for 2023 and 2024 and this is a combined limit for each year. Therefore, if you are over the payment limit from Stage 1, you will not collect a payment under Stage 2.
Here is a snapshot of our calculator using their numbers from the example:
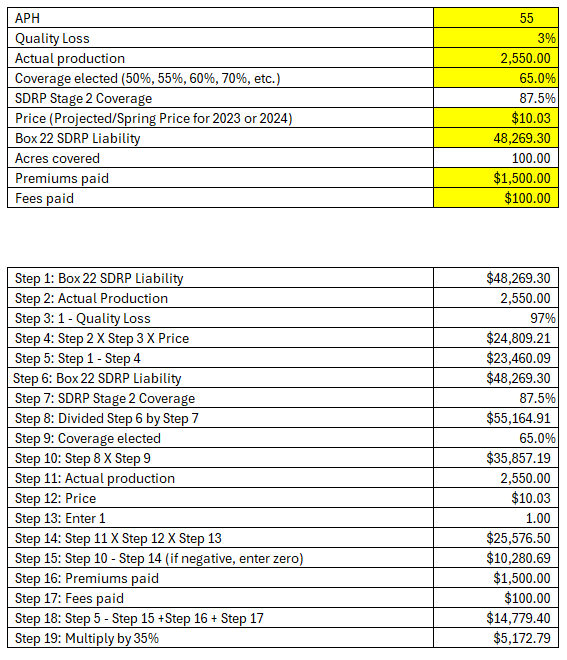
Let’s go through these step-by-step:
Step 1 is the amount listed in your pre-filled application Box 22 for each crop. This amount is based on the projected price for most of the crops for 2023 and 2024.
Step 2 is the actual production shown in Box 23.
Step 3 is the number 1 minus any quality loss that you are applying for. You enter that quality loss percentage and then it calculates the resulting percentage. For most farmers there will be no quality loss, and this number will be 1 (you will enter 0 for quality loss).
Step 4 is the product of multiplying Step 2, Step 3, and the price you entered above which is the projected price.
Step 5 is Step 1 minus Step 4. This determines the maximum amount of “gross payment” you can receive. If this number is negative, you do not qualify for any Stage 2 payment and Step 19 will automatically become zero.
Step 6 inputs the Box 22 SDRP liability again.
Step 7 inputs the SDRP revised coverage level, in this example, the farmer elected 65% coverage, therefore, the SDRP coverage level is 87.5%.
Step 8 divides the box 22 SDRP liability the SDRP coverage level to arrive at the gross crop insurance coverage that was available based on your APH times acres times harvest price.
Step 9 then inputs the original coverage level elected.
Step 10 multiplies these two numbers to arrive at your original crop insurance guarantee amount.
Step 11 is actual production.
Step 12 is the harvest price.
Step 13 is the number 1 since quality loss would not affect this calculation.
Step 14 multiplies Step 11, Step 12 and Step 13 to arrive at the total harvest value that you generated.
Step 15 subtracts Step 14 from Step 13. This determines the amount of crop insurance that you originally received based on the harvest price. If the projected price was higher, that number is ignored (my assumption). We are not sure why they are using this since this was supposed to be for farmers who did not have an original indemnity.
Step 16 are the crop insurance premiums actually paid by the farmer for that crop.
Step 17 are fees actually paid by the farmer.
Step 18 takes the gross amount calculated in Step 5 (maximum gross payment), then subtracts the crop insurance indemnity payment likely actually collected by the farmer and then adds in the crop insurance premium and fees paid by the farmer.
Step 19 takes Step 18 and multiplies it by 35% to arrive at the initial payment under Stage 2.
We hope this provides clarity on how FSA is calculating the payment. We have received feedback that the numbers in Box 23 for actual production may need to be updated. Care must be taken to make sure those numbers are correct. If you believe they are incorrect, you may need to provide settlement sheets to your local FSA office.
Here is a copy of the calculator:
I received a payment under Stage 1. Is it possible I could be eligible for a stage 2 payment also?