



If you raise dry peas in the Northern Plains or the Northwest, 2025 handed you a brutal crop. Yields in a lot of counties came in at a third — sometimes a fifth — of normal. You would think a revenue program would answer a loss like that with a big payment. ARC-CO does not, and the reason is one number: the 12% cap.
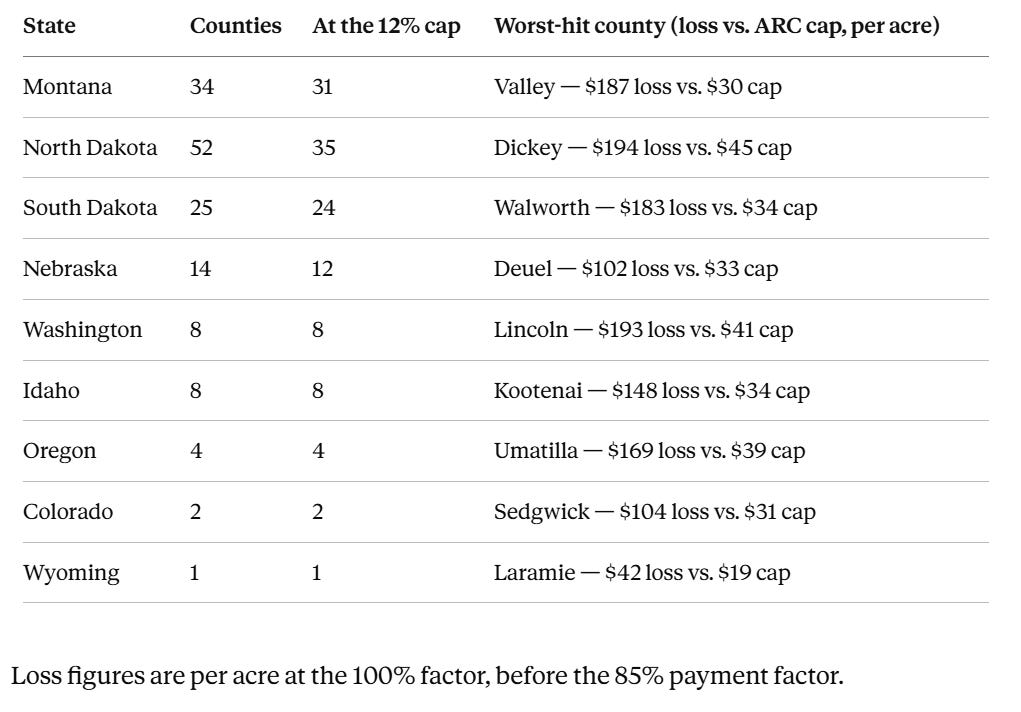
Here is the takeaway. Across Montana and eight other dry pea states, I ran the 2025 ARC-CO numbers county by county. Out of 148 counties, 125 — about 84% — are pinned against the ARC payment cap. That means the county’s revenue loss blew right past what ARC will pay, and the program covers only a sliver of the actual damage.
How the cap works
ARC-CO is shallow-loss coverage by design. For 2025 the math (with the OBBBA changes) runs like this:
Benchmark revenue = benchmark yield × benchmark price ($0.1477/lb for peas).
Guarantee = 90% of benchmark revenue (OBBBA raised this from 86%).
Actual revenue = the county’s 2025 yield × the projected MYA price ($0.1110/lb).
ARC payment = the guarantee minus actual revenue — but never more than 12% of benchmark revenue (OBBBA raised the cap from 10%). Then paid on 85% of base acres.
That 12% ceiling is the whole story. ARC was built to cover the top slice of a loss — the band just below the guarantee — and nothing deeper. In a normal year that is fine. In a collapse year it means the check stops far short of the loss.
Valley County, Montana — the loss that ARC won’t cover
Valley County is the clearest example in the whole set. Peas there came in at 351 pounds — about 21% of the 1,702-pound benchmark. Walk the numbers:
Benchmark revenue: 1,702 × $0.1477 = $251/acre
Guarantee (90%): $226/acre
2025 actual revenue: 351 × $0.1110 = $39/acre
Revenue shortfall: 226 − 39 = $187/acre
ARC cap (12% of benchmark): $30/acre
ARC payment (× 85%): about $26/acre
The county lost $187 an acre against its guarantee. ARC pays $26. More than $157 an acre of the loss sits above the cap, and ARC covers none of it. That is not a glitch — that is the program working exactly as written.
The same pattern across the states
Valley is extreme, but it is not alone. Every state in this pulse belt shows the same thing — a big share of counties maxed out, with a real loss well beyond what ARC will pay:
The North Dakota twist
There is one wrinkle worth flagging. In most of these states ARC-CO still pays more than PLC — the 12% cap, small as it is, still beats the thin PLC rate. North Dakota is the exception. Its benchmark yields are the highest in the group (many counties over 2,000 pounds, some above 3,000), and PLC pays on 80% of that big benchmark with no percentage cap of its own. So, in the higher-yielding eastern and northern counties, PLC quietly wins — 14 of 52 counties, and the statewide average tips to PLC ($29 vs. $25 an acre). The same cap that holds ARC down in every state finally lets PLC pass it where benchmarks run high.
The bottom line
For 2025 you do not have to choose. OBBBA pays the higher of ARC-CO or PLC automatically — no election. So a Valley County producer still collects the larger of the two checks. But do not mistake an ARC-CO payment for loss coverage this year. In 84% of these dry pea counties, ARC is capped out, and the payment reflects a 12% band, not the loss your bins actually show.
If you farm peas in these states, know your county’s benchmark and your own PLC yield before you count on ARC to backstop a short crop. The county spreadsheets behind these numbers let you drop in your base acres and PLC yield and see the higher-of figure for your operation.
Estimates use the official FSA 2025 ARC-CO dry pea benchmark yields, real RMA harvested county yields, and the projected $0.1110/lb MYA price.
Here are the spreadsheets for the various states (for paid subscribers only):
