

What the Increase in Base Acres by State Might Look Like
We provide a chart showing the estimated increase in base acres by state and crop


OBBBA provides for an increase of up to 30 million base acres from the current approximate 275 million base acres.
North Dakota State University has provided their estimates of the increase in base acres by state, by crop, etc. in a report entitled “Estimated Additional Base Acres Under OBBBA for Crop Year 2026”. The actual white paper is included as a download with this post.
We reviewed the white paper and created a heat map showing the increases in base acres by state and by crop shading from largest to smallest and here is that chart:
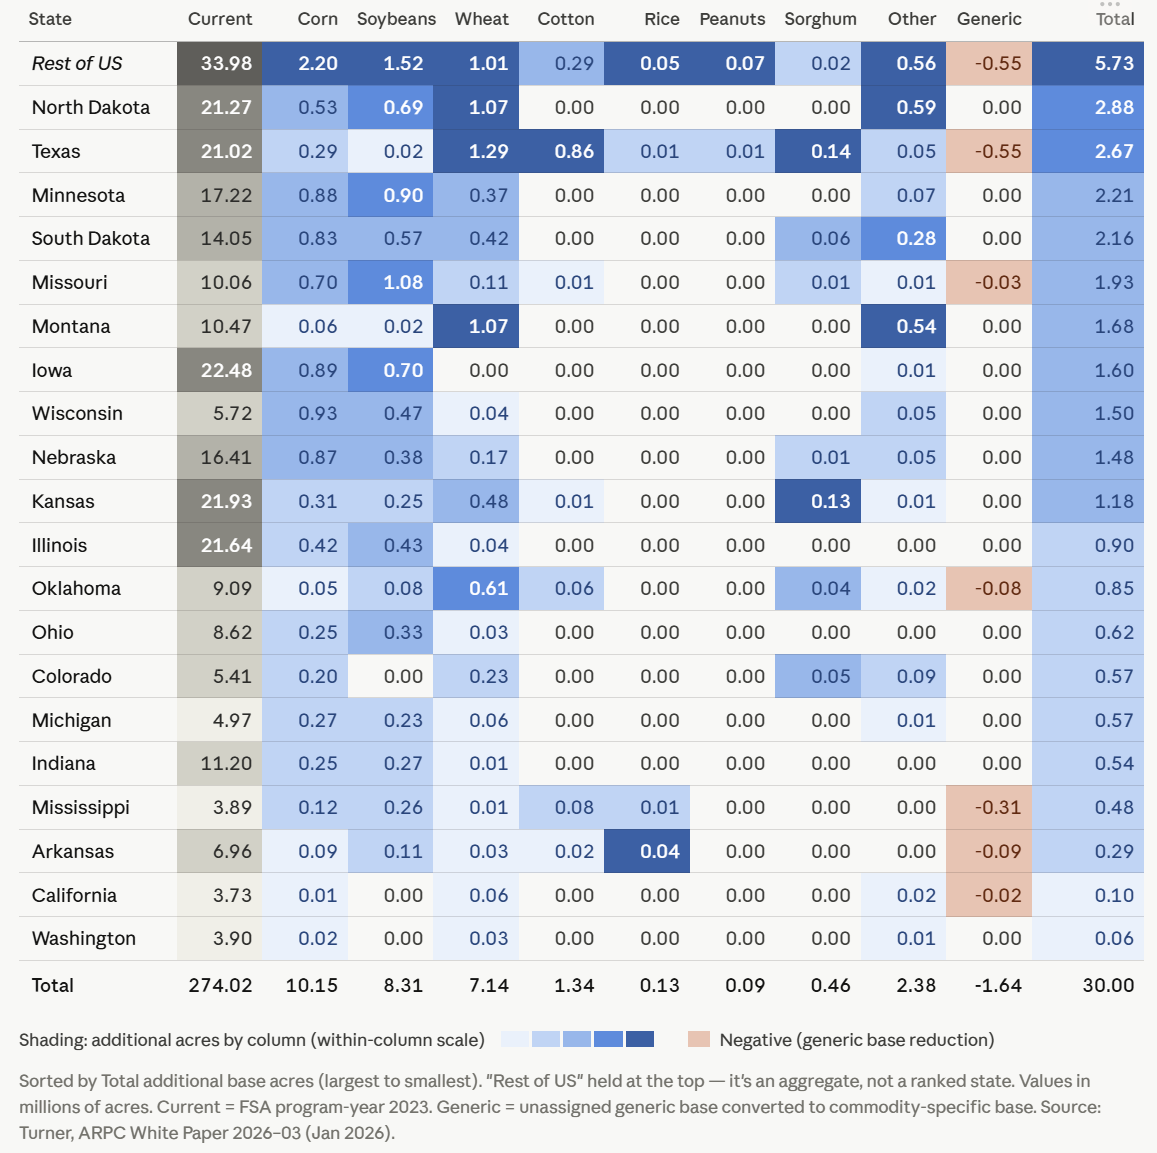
Although corn base acres will see the largest increase overall, it is interesting to note that the only crop to see more than a million increase in base acres by crop will be wheat in Texas, Montana and North Dakota, except Missouri will see a 1.08 million increase in soybean acres.
Here is the original Table A3 from the white paper showing the overall total increase in base acres by crop:
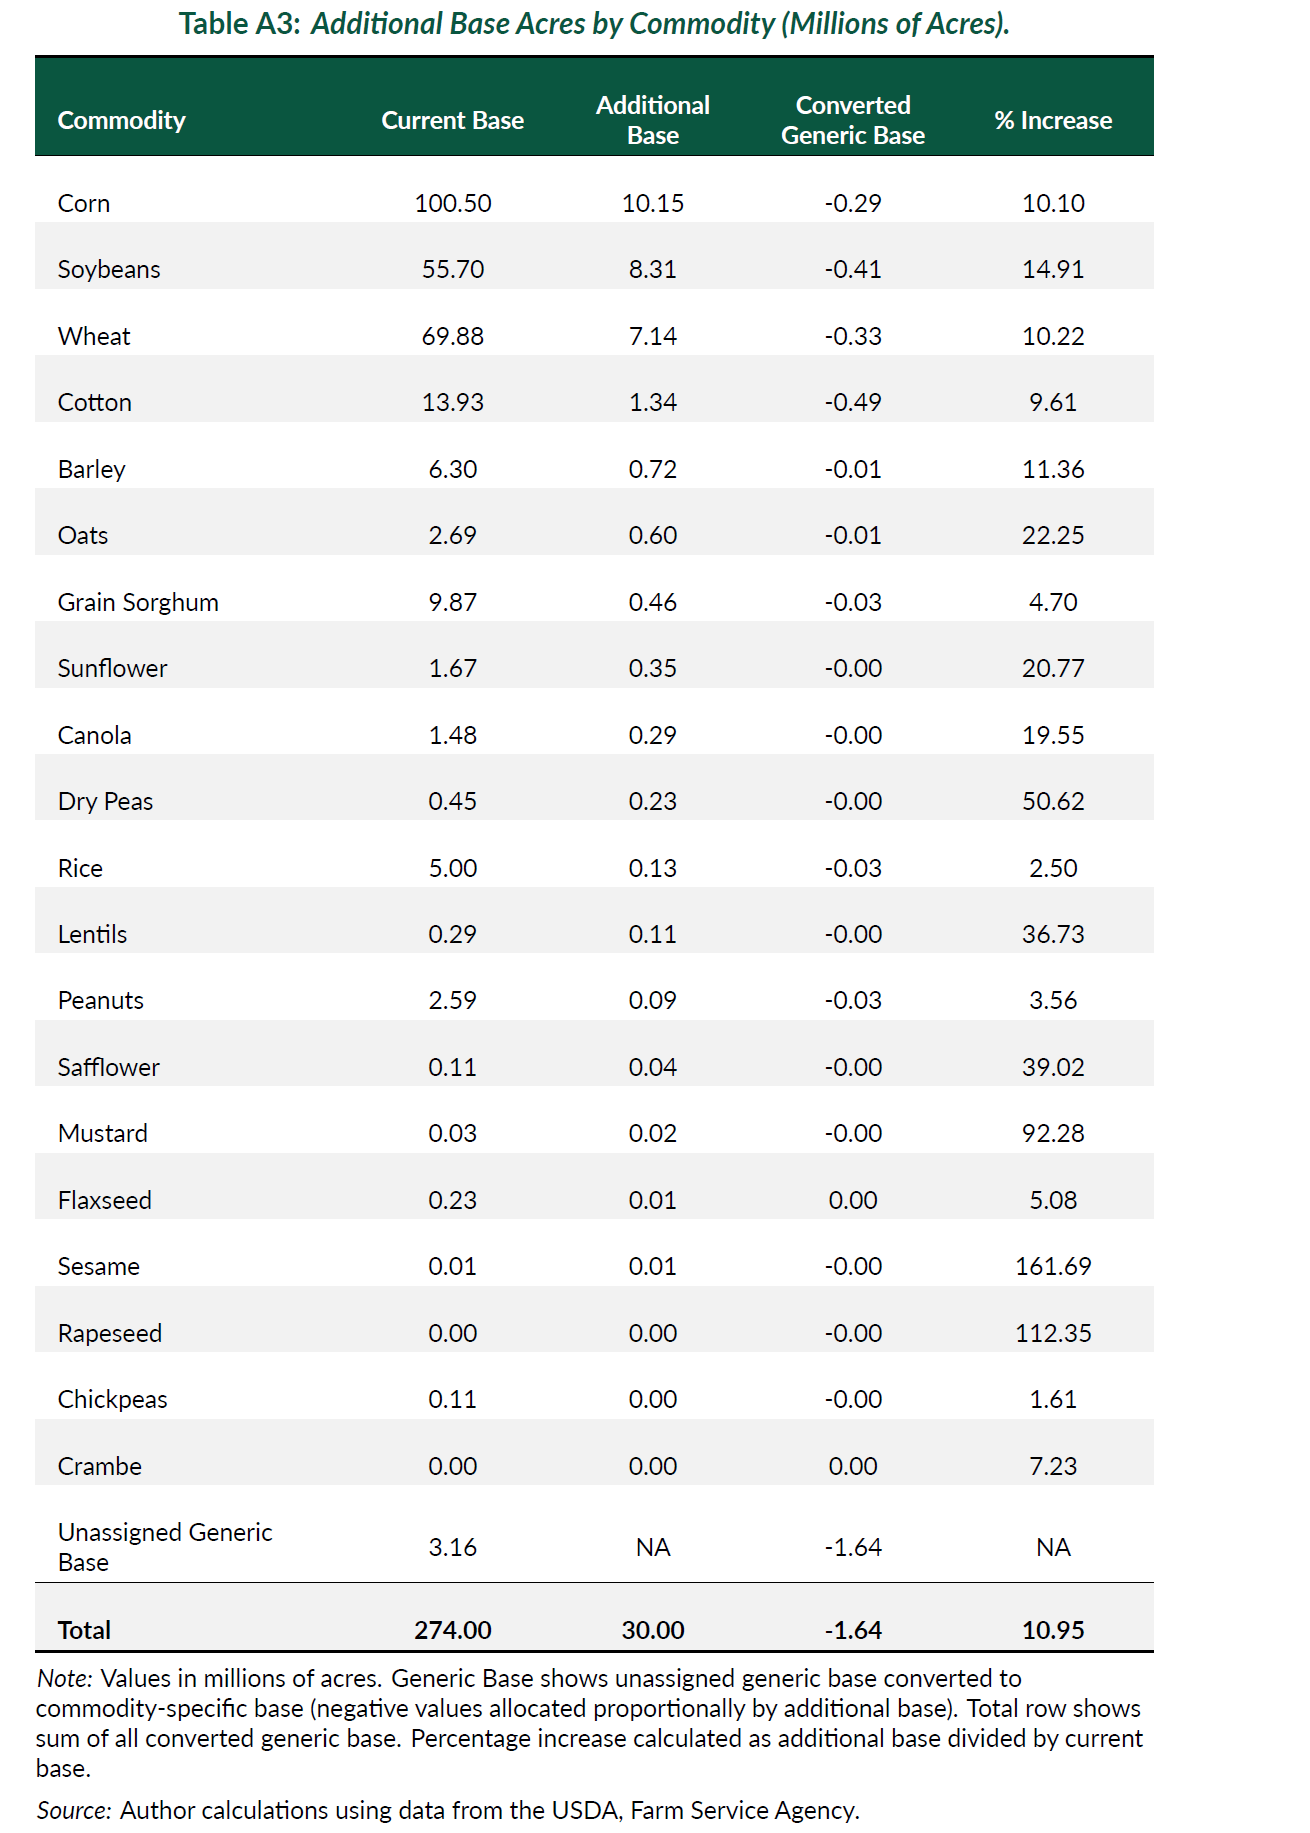
Warning, we believe that the column showing current base is actually the new base after the acres are added, therefore, the percentage increase will be slightly higher for each crop.
Note that there will be a minimal increase in rice and peanuts since much of that acreage has been converted to other crops during the 2019-2023 period. For example, rice farmers could see payments exceeding $300 per acre in 2025. For 2026, assuming the same payment rates, their increase in payments for rice based strictly on the increase in base acres in only 2.5% on average versus other crops that may see an increase substantially in excess of that percentage. For the major crops, this is by far the smallest increase with grain sorghum and cotton the only two other crops under a 10% increase.
USDA has a May 15 deadline to get all of the acres finalized and we would expect to start seeing the new base acre allocations shortly thereafter. We will keep you posted.