

Wheat Country by the Numbers: The Top 10 Counties for Base Acres, PLC Yield and Total PLC Production
I'm a nerd of numbers and are providing some interesting data on Wheat Production in the US


I grew up on a wheat farm in Walla Walla County, Washington, and to this day my idea of therapy is climbing into a combine and cutting wheat on a 40 percent slope every summer. So, when a spreadsheet of USDA wheat base acres and PLC yields lands on my desk, I don’t file it away — I dig in. Here is what the 2025 program-year numbers say about where the wheat really is, told through three different lists that each crown a different king.
A little background first. “Base acres” are the program acres a farm has enrolled for wheat under ARC and PLC — think of it as how much wheat program ground a county carries, regardless of what’s planted in any given year. The “PLC yield” is the per-acre program yield, in bushels, that USDA plugs into the PLC payment formula.
Multiply the two together and you get what the data calls Total PLC Yield — base acres times PLC yield — which is really a measure of total program bushels, and the best single proxy for how big a county’s PLC payment can get when prices fall below the reference price.
But remember that USDA is currently updating Base Acres and for many counties on this list will see at least a 10% increase in Base Acres.
Three lists. The first rewards sheer acreage. The second rewards acreage and productivity. The third rewards pure productivity, and it turns the whole map upside down.
List 1: Top 10 counties by wheat base acres
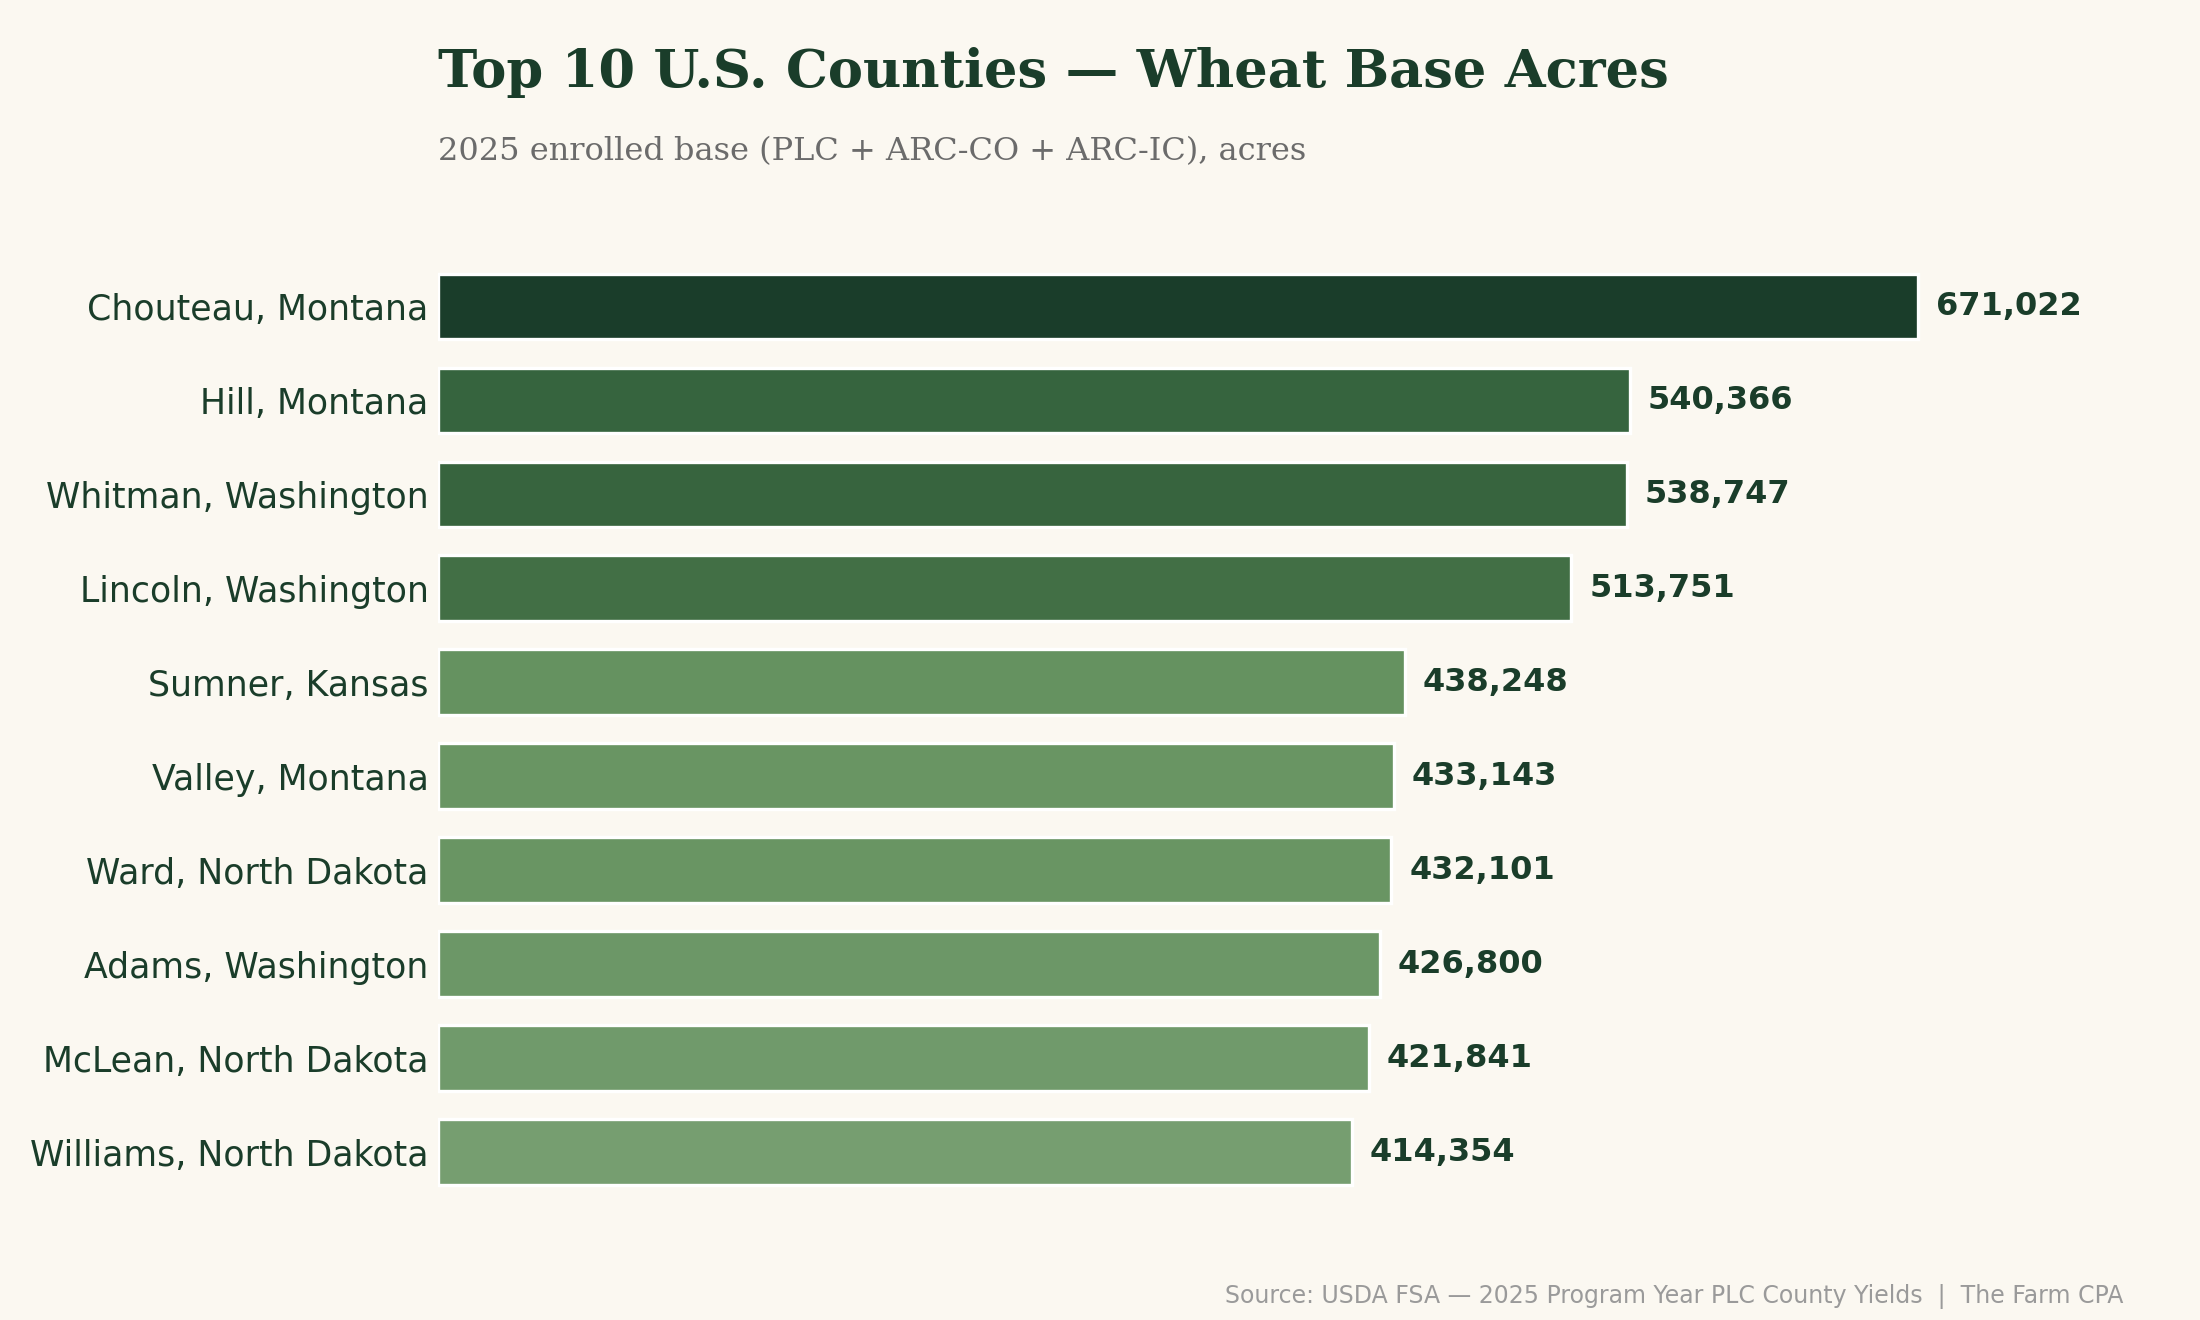
Montana, North Dakota, and Washington each grab three spots, with Kansas (Sumner) rounding it out. Chouteau County, Montana sits on top with 671,022 base acres — that’s more than 1 percent of all wheat base acres in the entire country in a single county. For perspective, total U.S. wheat base runs about 60.2 million acres.
List 2: Top 10 counties by total PLC Wheat Production
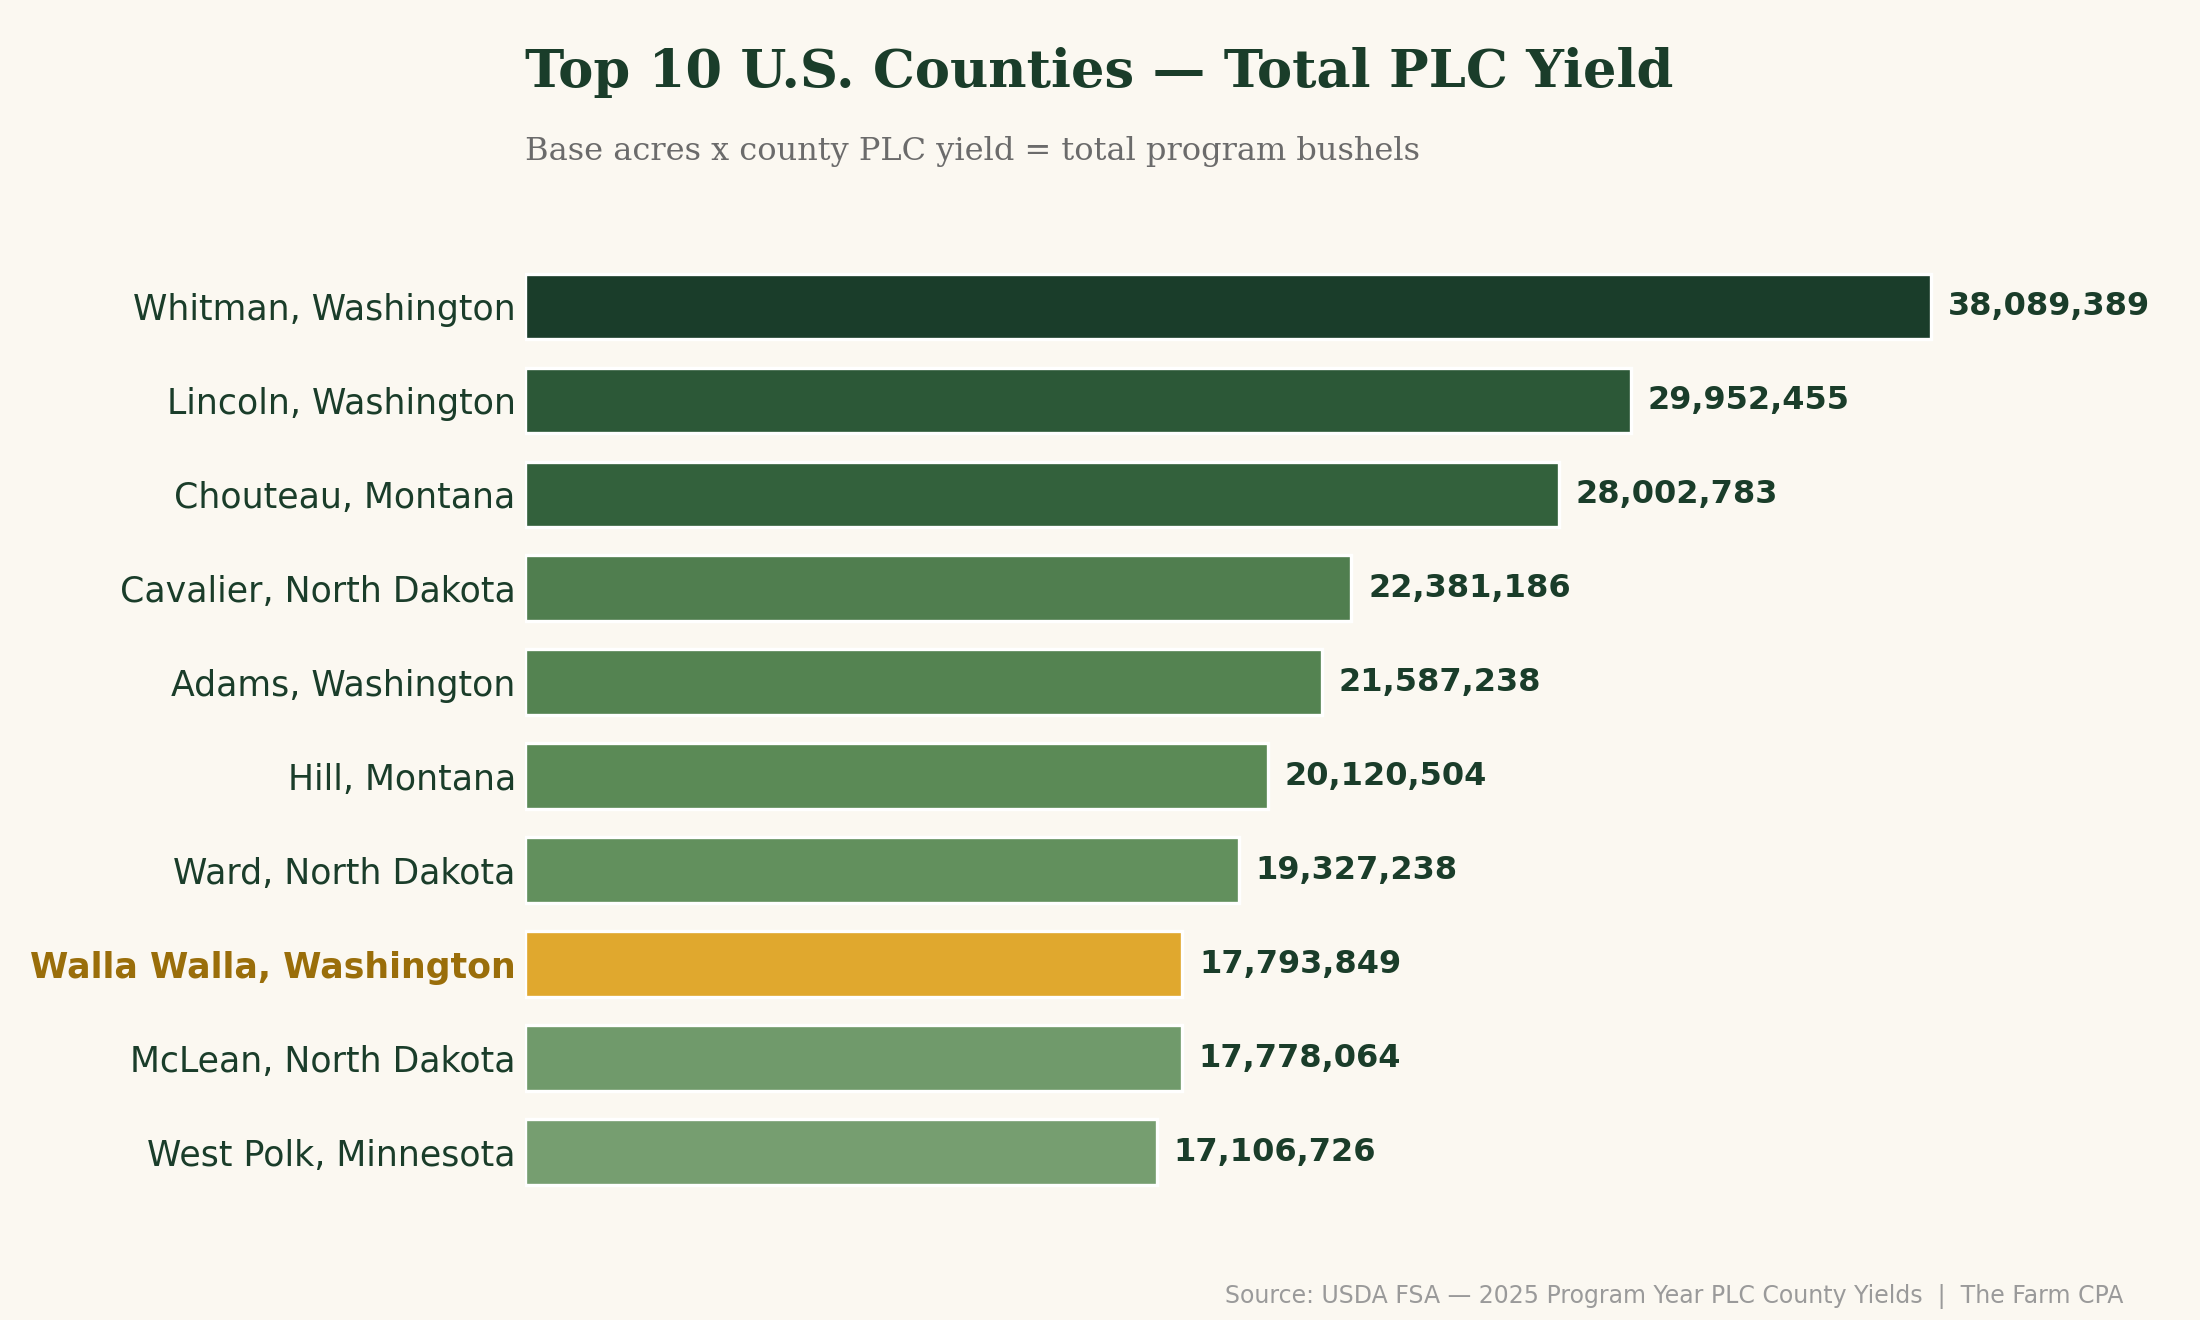
Look at what productivity does. Chouteau, Montana had a comfortable lead on base acres but drops to third here, because its PLC yield is only about 41.7 bushels per acre. Whitman County, Washington jumps from third to first — fewer base acres than Chouteau, but a PLC yield of 70.7 bushels carries it to 38.1 million program bushels, the highest in the nation.
And then there’s my home county. Walla Walla, Washington cracks the top 10 at number 8 — on roughly 247,000 base acres, less than half of what the leaders carry. It gets there on yield. Walla Walla’s PLC yield of 71.9 bushels per acre is the highest of any county on either of the first two lists — a notch above even Whitman. Those Palouse and Blue Mountain slopes I grew up cutting may be steep, but the dirt is some of the most productive dryland wheat ground anywhere in the country, and the program yields prove it.
List 3: Top 10 counties by Wheat PLC Yield Per Acre
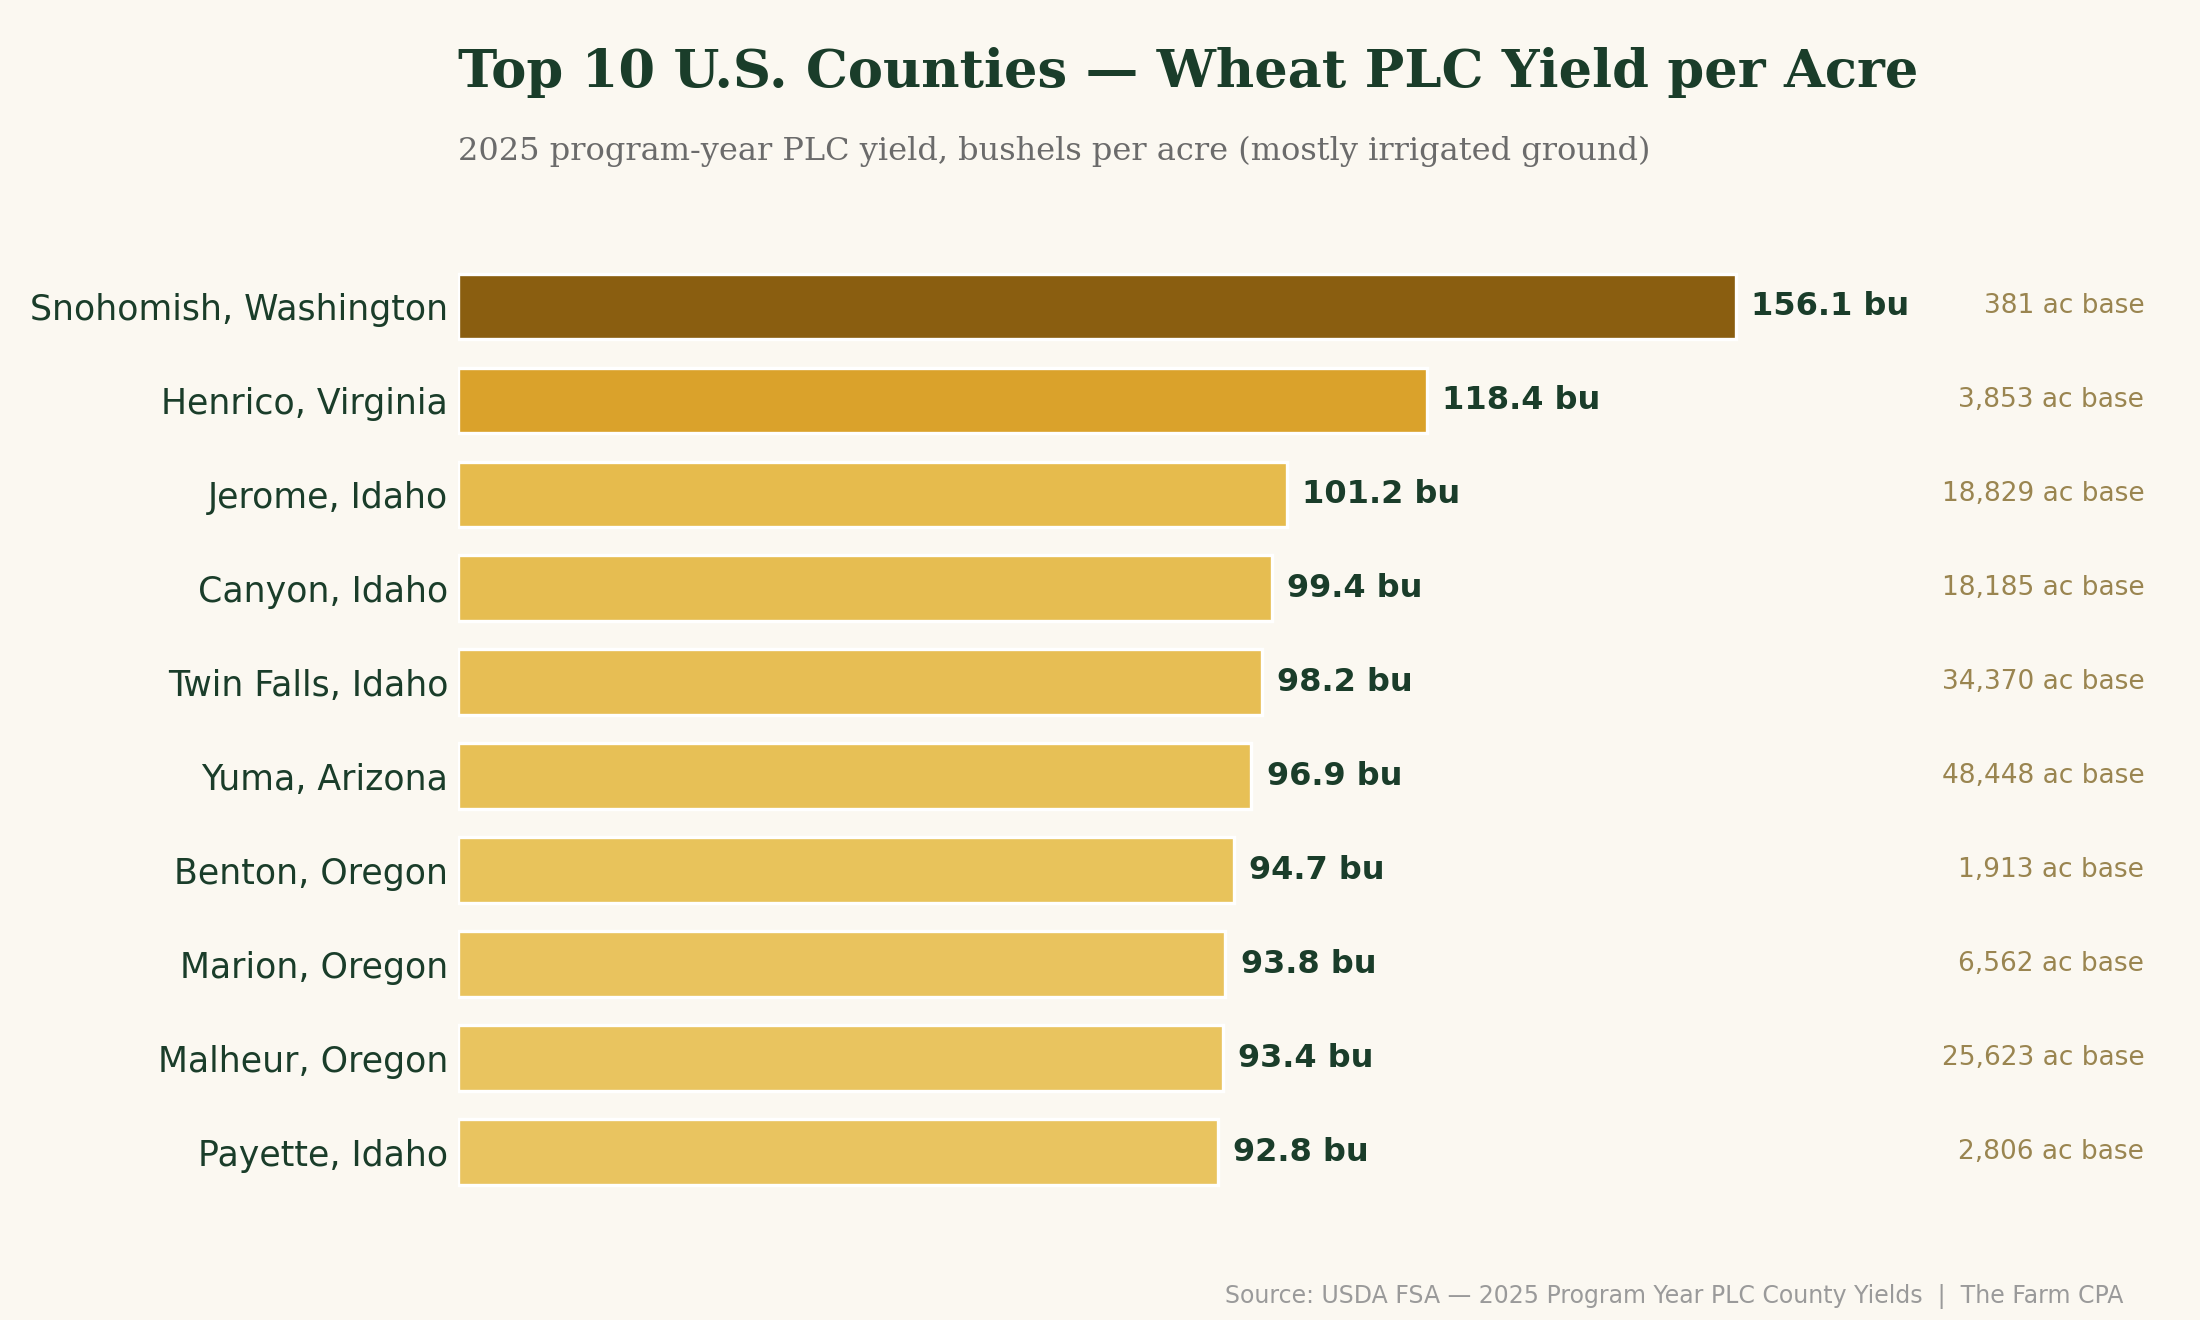
The first two lists reward volume. This one strips acreage out entirely and ranks on raw PLC yield per acre. This is mostly irrigated wheat country. Benton and Marion Counties in Oregon may make the list based on non-irrigation, but most of the other counties are irrigated.
Idaho takes four of the ten spots and Oregon three. The headline number — Snohomish County, Washington at 156.1 bushels per acre — comes off just 381 base acres, so it’s a high-yield curiosity. Run your eye down the base-acre figures on the right side of the chart and you see the catch: most of these counties carry a sliver of the program ground the volume leaders do.
That’s the irrigation story. Where you can put water on it, dryland yields in the 40s and 70s give way to 90 to 100-plus bushels. My home county’s 71.9-bushel dryland yield in Walla Walla is outstanding for ground that drinks only what the sky gives it — but it’s barely 70% of what irrigated Jerome County, Idaho posts.
These lists are more than trivia. PLC pays when the season-average price for wheat drops below the effective reference price, and the payment scales directly with base acres times the PLC yield. OBBBA raised wheat’s reference price to $6.35 a bushel starting with the 2025 crop, which makes a PLC payment more likely the next time the market sags.
When that happens, the two volume lists tell you where the largest aggregate PLC checks get written — the counties combining big base and high yields. The productivity list tells a different story for the individual grower: an irrigated county sitting at a 100-bushel PLC yield earns close to double the per-acre PLC payment of a 50-bushel dryland county at the same price shortfall. The catch is base — those high-yield counties have so little of it that they don’t move the national needle, but for the grower standing on that ground, the per-acre payment is real money.
For my farm clients, the takeaway is the same whether you’re farming 60,000 acres of dryland or 2,000 irrigated: know your county’s PLC yield, know your base, and run the math before you assume a payment is coming or that you’re clear of the limit. The dirt under your combine is only half the story. The number USDA assigns it is the other half.
Now if you’ll excuse me, I’ve got a slope to go find.